Packages
NOS-TLPlot ships as two installable packages, the Python package on PyPI and the nos.tlplotR R package. Both drive the same plotting engine, so the figures come out identical: publication-ready, 300 DPI, in png, pdf, svg and tiff.
Python package: nos-tlplot
The original engine. Every visualization, the four colour themes and the batch command line, installable from PyPI.
Install
pip install nos-tlplotUse in two lines
import nos_tlplot

df = nos_tlplot.read_input_file("my_nos_data.csv")
df = nos_tlplot.process_detailed_nos(df)
nos_tlplot.plot_nos_visualization(df, "nos_plot.png")
Or generate the complete set of thirteen figures at once from the terminal:
nos-tlplot my_nos_data.csv nos_plot.pngR package: nos.tlplotR
The official R interface to nos-tlplot, built with reticulate. Same figures, same themes,
same data format, straight from your R session or R Markdown document.
See the full documentation.
Install
remotes::install_github("nos-tlplot/nos.tlplotR")CRAN submission in progress.
Use in two lines
library(nos.tlplotR)

plot_nos_visualization("my_nos_data.csv", "nos_plot.png")
Or everything at once. One call writes all thirteen figures:
files <- plot_all("my_nos_data.csv", "nos.png")Same data, same figures
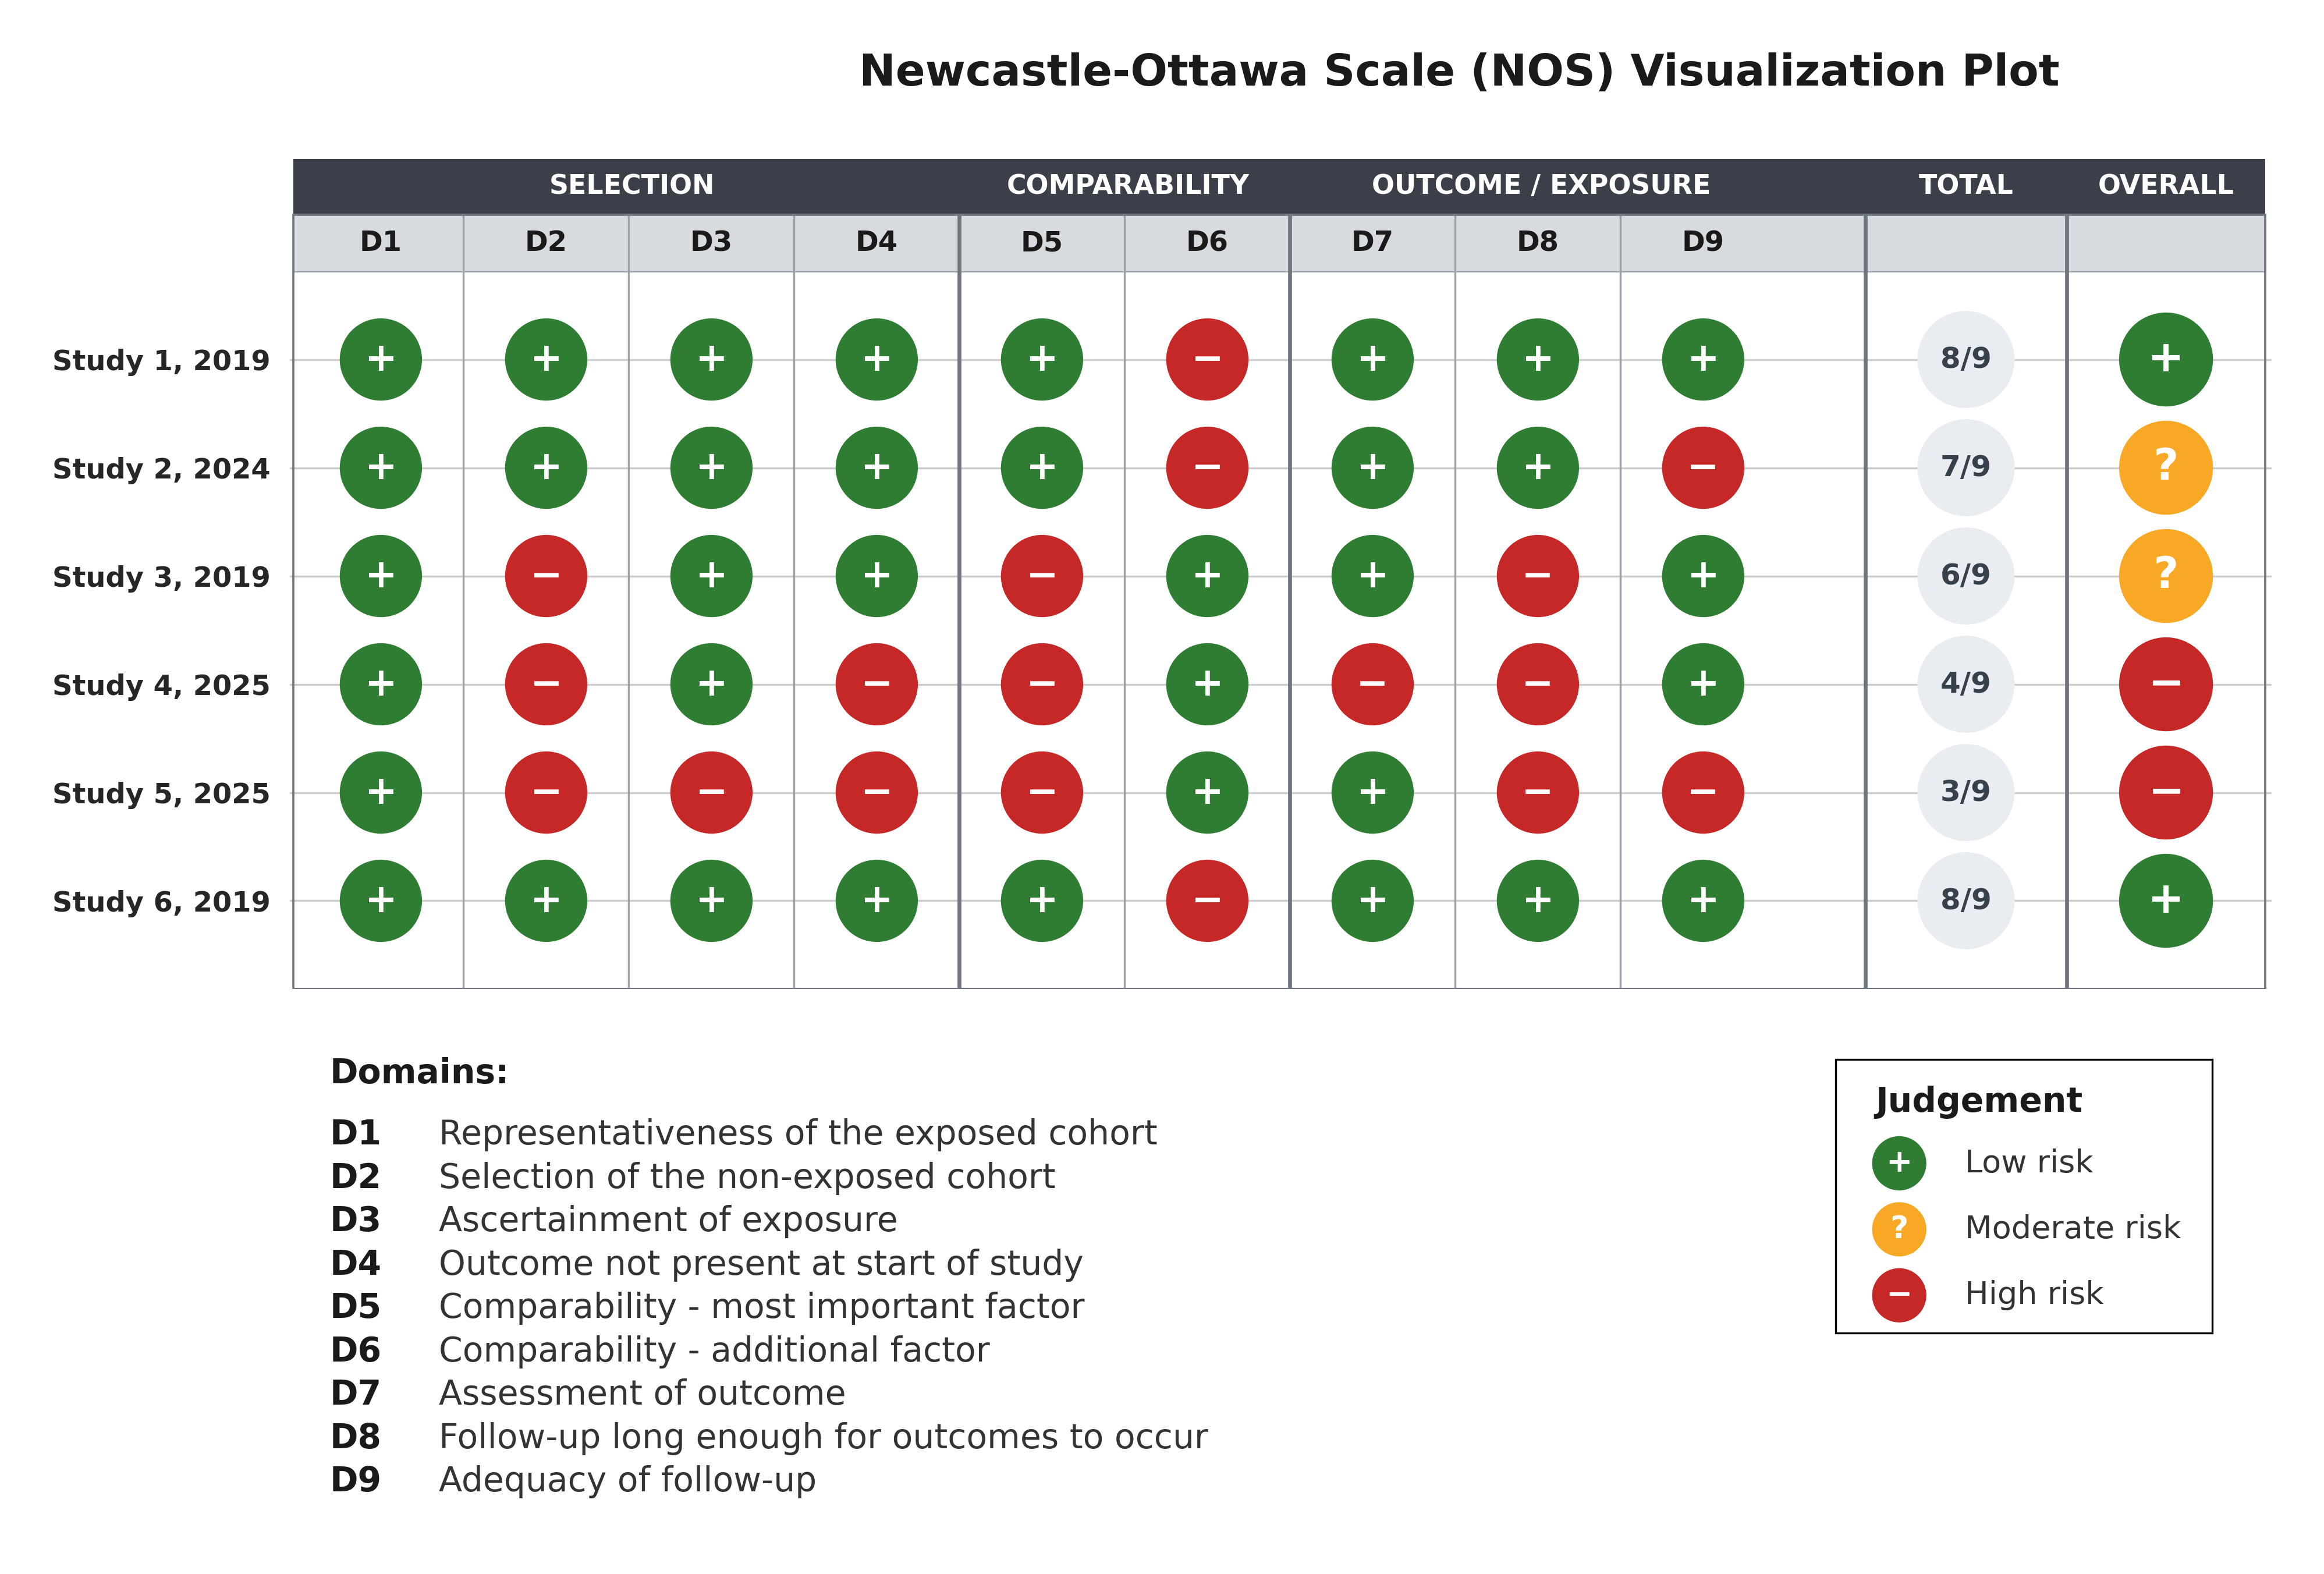
Both packages read the same Newcastle-Ottawa Scale table (one row per study, one column per item,
0 to 9 stars, input data reference) and render the identical
thirteen visualizations in the
traffic_light, gray, ocean and sage themes.
Which one should you use? Pick the language your review workflow already lives in. The plots are guaranteed to match.